

PHOENIX — An ABC15 analysis of Phoenix police traffic citation data has identified ticket “hot spots” citywide and highlights racial disparities in who is being ticketed.
We examined the latest available citywide police data, spanning from January 1 to September 9, 2025, finding 37,950 total civil and criminal traffic citations issued across Phoenix during that period.
A total of 10 hot spots were mapped where drivers received more tickets than other areas and population groups that received the most tickets per capita were identified.
Take a look at the interactive map below to see the traffic ticket “hot spots” in your community.
Traffic enforcement is influenced by many factors that don’t always align with population distribution: traffic volume, collision trends, calls for service, and the layout of our major corridors, according to the Phoenix Police Department.
Those specific areas highlighted in the map see more enforcement activity based on these factors, regardless of who lives in the surrounding neighborhood, Phoenix Police Commander Mercedes Fortune said in an emailed statement to ABC15.
“We analyze these operational factors carefully to understand why differences appear in the data and whether adjustments are needed,” Fortune said.
Racial Disparities
Black drivers may receive fewer tickets than white or Hispanic drivers in Phoenix, but, on a per-capita basis, Black drivers are the most frequently ticketed group.
White drivers received about 15,530 traffic citations. Hispanic/Latino drivers received 14,960 citations. Black and African American drivers received far fewer citations — about 5,095 citations.
Our per-capita analysis found 23 tickets per 1,000 white Phoenix residents and nearly the same rate — 23 per 1,000 — for Hispanic residents. But for Black residents, the rate was 43 tickets per 1,000 — nearly double the propensity.
The disparity is even more pronounced among younger Black men. The citywide average was 25 tickets per 1,000 Phoenix residents. But for Black men ages 20 to 29, the rate was 100 tickets per 1,000. For Black men ages 30 to 39, it was 91 tickets per 1,000.
Kenneth Smith, a Black community organizer and former candidate for Phoenix City Council, said the findings reflect longstanding concerns about racial disparity in policing.
"It's not surprising as much as it is disheartening," Smith said.
Smith said the data points to a deliberate pattern.
“Your intentions are where the data is," Smith said. “To be Phoenix, Arizona, and have a small, very small population of Black people, but being the area in which they live the most is over-policed, it shows where their intentions are.”
Commander Fortune, who declined an on-camera interview on behalf of the department, responded in an email statement, saying, “The Police Department reviews our traffic enforcement data closely, and we pay attention when we see disparities.“
Fortune acknowledged, from January through September 2025, 13.43% of Phoenix police traffic citations involved African American drivers and that percentage is higher than the city’s African American population.
“A disparity in numbers does not automatically mean bias, but it does mean we look deeper to understand what is driving it,” Fortune said. She also emphasized the department’s expectation that enforcement actions are based on violations and safety priorities, not on race.
“Our commitment is to ensure all communities are policed fairly and without bias,” Fortune said.
Phoenix’s Ticket Hot Spots
The analysis also identified geographic concentrations of citations in Phoenix.
The highest-volume area for traffic tickets is near the intersection of 16th Street and Broadway Road in South Phoenix. Phoenix police identify the half-mile by half-mile area on their crime map grid as AF30. Police issued 297 citations in that area alone, from January 1 to September 9, 2025.
Four of Phoenix’s top 10 ticket hot spots are in South Phoenix, adjacent to a stretch of Broadway Road, which is also known as Dr. Martin Luther King Jr. Boulevard.
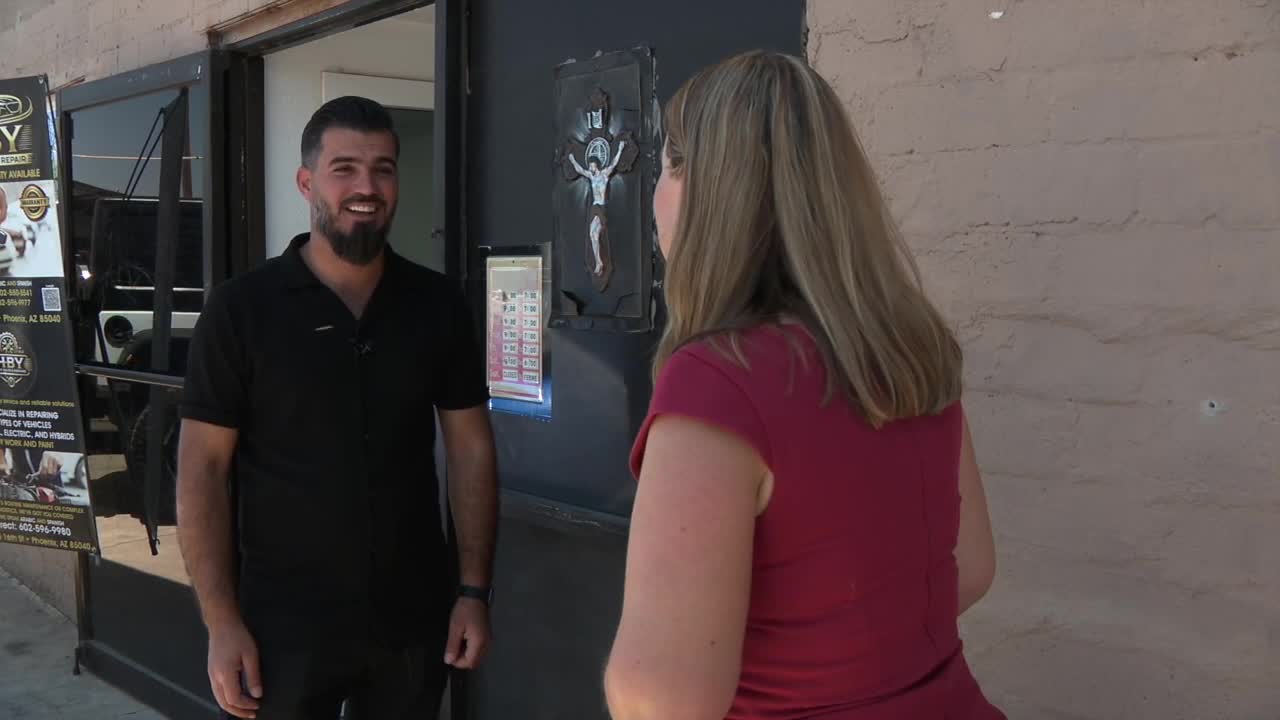
At HBY Auto Sales, a used car lot in the area, Bahnam Kheder said he warns customers heading out on test drives to be careful.
"I say go slow,” Kheder said. “Don't speed in this area because you're getting a ticket."
He said police are frequently in the area.
“The most area I've seen police in - it is 16th Street," Kheder said.
Kheder acknowledged that he often sees drivers speeding down 16th Street from Interstate 17, which gives officers reason to make stops.
Between Thursday and Saturday is the peak patrol time, according to Kheder. He added that sometimes multiple police vehicles will “stop and they hide."
Other ticket hot spots include Maryvale, from Indian School to Camelback Road between 59th and 67th avenues, the area around Chase Field in downtown Phoenix, and an area near the intersection of Jomax Road and Tatum Boulevard.

ABC15 is committed to finding the answers you need and holding those accountable.
Submit your news tip to Investigators@abc15.com
“We have safeguards in place—supervisor oversight, policies, body‑worn cameras, data reviews, and ongoing training—to ensure fair and consistent policing,” Commander Fortune said. “When we see disparities, we don’t ignore them. We examine them, we look for root causes, and we make changes when appropriate.”
Overall, the Black Mountain and Cactus Park precincts issued the most tickets.
Read the full Phoenix Police statement:
“The Police Department reviews our traffic enforcement data closely, and we pay attention when we see disparities. From January through September 2025, 13.43 percent of our citations involved African American drivers. We recognize that this percentage is higher than the city’s African American population, and we take that seriously. A disparity in numbers does not automatically mean bias, but it does mean we look deeper to understand what is driving it.
“Traffic enforcement is influenced by many factors that don’t always align with population distribution: traffic volume, collision trends, calls for service, and the layout of our major corridors. Those specific areas see more enforcement activity based on these factors, regardless of who lives in the surrounding neighborhood. We analyze these operational factors carefully to understand why differences appear in the data and whether adjustments are needed.
“Our expectation is that every member of this department conducts enforcement based on violations and safety priorities, not on race. We have safeguards in place—supervisor oversight, policies,body‑worn cameras, data reviews, and ongoing training—to ensure fair and consistent policing. When we see disparities, we don’t ignore them. We examine them, we look for root causes, and we make changes when appropriate. Our commitment is to ensure all communities are policed fairly and without bias.”